Pandas extension for financial data processing and visualization

Project description
Pandastock
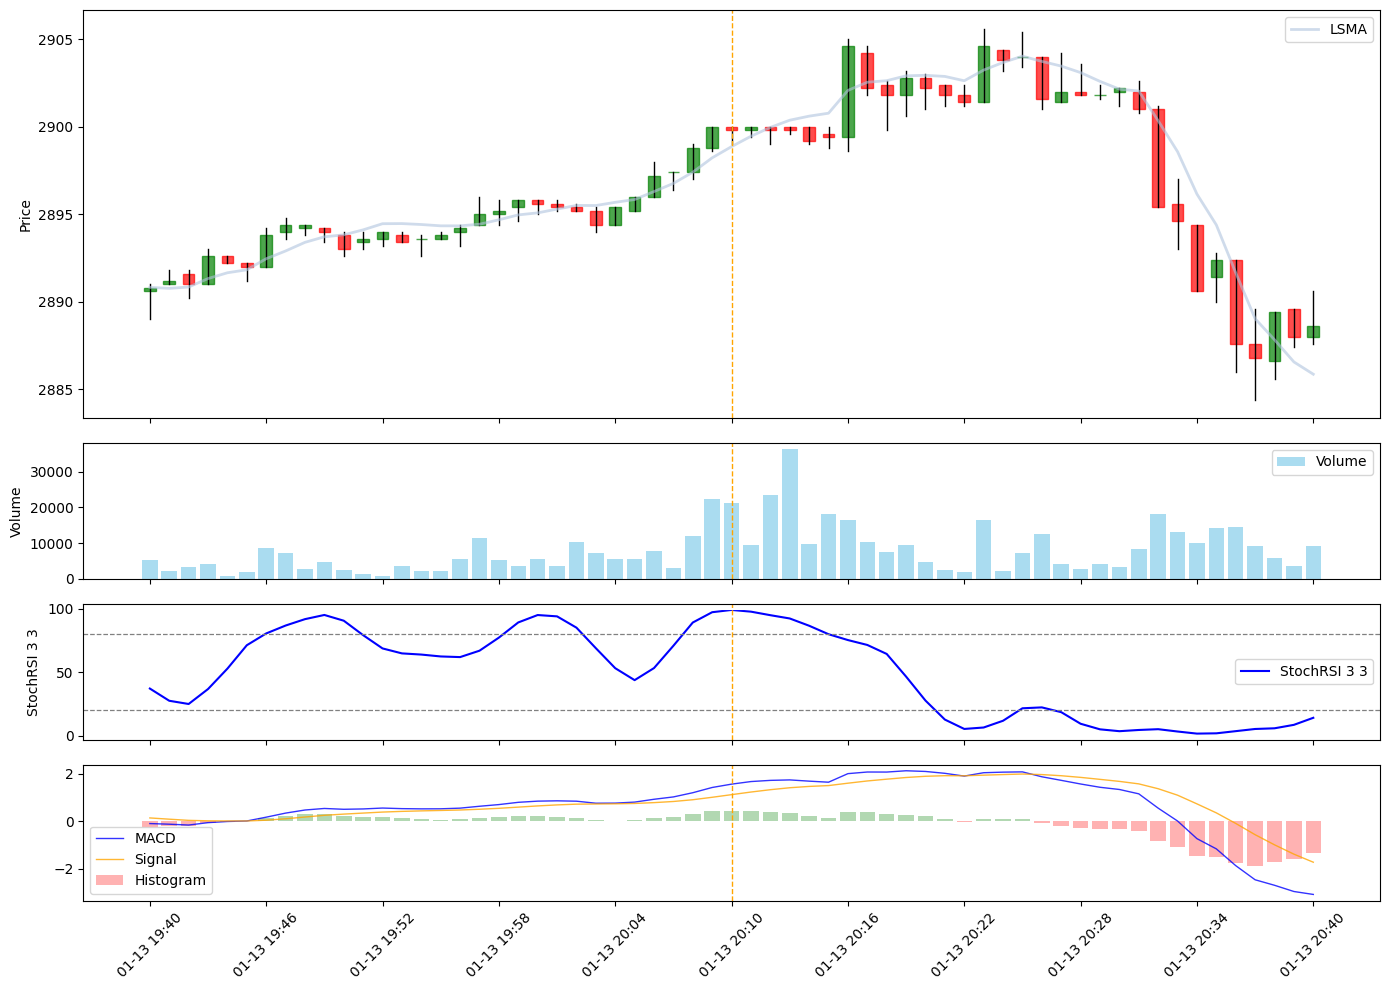
A simple pandas extension for financial data processing and visualization. Pandastock makes it easy to plot candlestick charts from pandas DataFrames and overlay technical indicators.
Key features
- 📊 DataFrame Charting: Build charts right from pandas DataFrame
- 📈 Technical Indicators: Built-in support for most popular indicators and interface for adding new indicators
- 🔄 Streaming support: Real-time indicator calculation with
next_value() - 📁 Easy Data Loading: Convenient functions to load candle data from single CSV file, list of files or directory
Installation
pip install pandastock
Or install from source:
git clone https://github.com/alexeyshesh/pandastock.git
cd pandastock
pip install -e .
Quick Start
Basic Usage
import pandas as pd
from pandastock.candles import read_candles_from_csv
from pandastock.indicators import RSI, SMA, MACD

# Load candlestick data from CSV
# CSV must have columns: timestamp, open, high, low, close, volume
df = read_candles_from_csv('data.csv')

# Add indicators
df.candles.add_indicators(
    rsi_14=RSI(period=14),
    sma_20=SMA(window=20),
    macd=MACD()
)

# Plot the chart
df.candles.plot('2025-01-13 20:10:00', window=30)
Data Loading
Pandastock provides several convenient functions to load candlestick data:
Load from Single CSV File
from pandastock.candles import read_candles_from_csv

# Load data from a single CSV file
df = read_candles_from_csv('data.csv')

# Optional: Aggregate data to different timeframes
df_hourly = read_candles_from_csv('data.csv', agg='1H')
df_daily = read_candles_from_csv('data.csv', agg='1D')

# Optional: Remove weekend data
df = read_candles_from_csv('data.csv', remove_weekend=True)
Load from Multiple CSV Files
from pandastock.candles import read_candles_from_csv_list

# Load and combine multiple CSV files
df = read_candles_from_csv_list([
    'data_2025-01-01.csv',
    'data_2025-01-02.csv',
    'data_2025-01-03.csv'
])
Load from Directory Range
from pandastock.candles import read_candles_csv_range

# Load all CSV files in a directory within a date range
df = read_candles_csv_range(
    dir='data/YDEX',
    from_='2025-01-01',
    to_='2025-01-31',
    agg='1H'
)
Available Indicators
Pandastock provides several built-in indicators:
- RSI (Relative Strength Index)
- SMA (Simple Moving Average)
- LSMA (Least Squares Moving Average)
- MACD (Moving Average Convergence Divergence)
- Stochastic RSI
Example:
from pandastock.indicators import RSI

# Create RSI indicator with default period (14)
rsi = RSI()

# Custom period
rsi_20 = RSI(period=20)

# Add to dataframe
df.candles.add_indicators(rsi=rsi)
Plotting
Basic Plot
# Plot centered on a specific timestamp
df.candles.plot('2025-01-13 20:10:00')
Custom Window Size
# Plot with custom window size (number of candles on each side)
df.candles.plot('2025-01-13 20:10:00', window=50)
Date Range
# Plot specific date range
df.candles.plot(
    center_time='2025-01-13 20:10:00',
    from_='2025-01-01',
    to_='2025-01-31'
)
Custom Figure Size
# Plot with custom figure size
df.candles.plot('2025-01-13 20:10:00', figsize=(16, 12))
Complete Example
Here's a complete example showing how to use pandastock:
import pandas as pd
from pandastock.candles import read_candles_csv_range
from pandastock.indicators import RSI, SMA, MACD, StochasticRSI, LSMA

# Load data from multiple CSV files in a directory
df = read_candles_csv_range(
    dir='data/YDEX',
    from_='2025-01-01',
    to_='2025-01-31',
    agg='1H'
)

# Add multiple indicators
df.candles.add_indicators(
    # Overlaid indicators (plotted on the same chart as candles)
    sma_20=SMA(window=20),
    sma_50=SMA(window=50),
    lsma_30=LSMA(window=30),

    # Under indicators (plotted in separate subplots)
    rsi_14=RSI(period=14),
    macd=MACD(fast=12, slow=26, signal=9),
    stoch_rsi=StochasticRSI(period=14, k=3, d=3)
)

# Plot the chart
df.candles.plot(
    center_time='2025-01-15 10:00:00',
    window=40,
    figsize=(14, 10)
)

# Access indicator values
print(df[['close', 'sma_20__sma', 'sma_50__sma', 'rsi_14__rsi']].tail())
Indicator Plot Positions
Indicators can be plotted in two positions:
- Over (
PlotPosition.over): Plotted on the same chart as candlesticks (e.g., SMA, LSMA) - Under (
PlotPosition.under): Plotted in separate subplots below the main chart (e.g., RSI, MACD, StochasticRSI)
Streaming Support
All indicators support streaming data processing with the next_value() method:
from pandastock.indicators import RSI

# Create indicator
rsi = RSI(period=14)

# Process candles one by one (streaming)
for _, candle in df.iterrows():
    result = rsi.next_value(candle)
    print(f"RSI: {result['rsi']}")
Data Format
Your CSV files should have the following columns:
timestamp: Date and time of the candleopen: Opening pricehigh: Highest pricelow: Lowest priceclose: Closing pricevolume: Trading volume
Example CSV format:
timestamp,open,high,low,close,volume
2025-01-01 00:00:00,100.0,105.0,99.0,104.0,1000
2025-01-01 01:00:00,104.0,108.0,103.0,107.0,1200
2025-01-01 02:00:00,107.0,110.0,106.0,109.0,900
License
GPL 3.0 License - see LICENSE file for details.
Contributing
Contributions are welcome! Please feel free to submit a Pull Request.
Author
Alexey Sheshukov - alexeyshesh@yandex.ru
Links
Release history Release notifications | RSS feed


Download files
Download the file for your platform. If you're not sure which to choose, learn more about installing packages.
Source Distribution
Built Distribution
Filter files by name, interpreter, ABI, and platform.
If you're not sure about the file name format, learn more about wheel file names.
Copy a direct link to the current filters
File details
Details for the file pandastock-0.0.6.tar.gz.
File metadata
- Download URL: pandastock-0.0.6.tar.gz
- Upload date:
- Size: 27.1 kB
- Tags: Source
- Uploaded using Trusted Publishing? No
- Uploaded via: twine/6.2.0 CPython/3.14.2
File hashes
| Algorithm | Hash digest | |
|---|---|---|
| SHA256 |
9563bbeff9b0a5eaae9f5c2f3055fedd5e7856af1a5cfa825f0c5fd5c2d3a573
|
|
| MD5 |
223da49ef9c0505c2294b7278702c5d7
|
|
| BLAKE2b-256 |
cc5a4417e75964bd8f56c0f73e6f9302c9c5947b9453355df9cd4b4f59d414dd
|
File details
Details for the file pandastock-0.0.6-py3-none-any.whl.
File metadata
- Download URL: pandastock-0.0.6-py3-none-any.whl
- Upload date:
- Size: 27.3 kB
- Tags: Python 3
- Uploaded using Trusted Publishing? No
- Uploaded via: twine/6.2.0 CPython/3.14.2
File hashes
| Algorithm | Hash digest | |
|---|---|---|
| SHA256 |
ceaccb57f811e7f5c68900f01611e6a0ed3454f778d9068b202062d90563ee9c
|
|
| MD5 |
f3de7421a077afb23cb1f9d1f9bb15e4
|
|
| BLAKE2b-256 |
4e62f0d5ddee256973bbd15247ba524c8097c3085e2258c40f70c48c6f1b9668
|


