Estimate PV single-diode model parameters from module datasheet values

Project description
pvfit5 — Estimation of the Five Parameters of the PV Single-Diode Model
Version: 1.2.0 | Date: 2026-04-23 | Author: Valerio Lo Brano


pvfit5 estimates the five parameters of the single-diode model (SDM) of a photovoltaic module at Standard Test Conditions (STC: 1000 W/m² irradiance, 25 °C cell temperature) using only commercial datasheet values.
A genetic algorithm (DEAP) coupled with the CEC model implementation in pvlib minimises a weighted combination of relative errors on Voc, Isc, Vmp, and Imp — plus a stationarity constraint at the maximum power point — and reconstructs the full I–V curve via the Lambert W method.
Paper
Lo Brano, V. (2026). Open and Reproducible Estimation of PV Single-Diode Parameters from Datasheet Data. Energy Reports (Open Access, CC-BY).
DOI: 10.1016/j.egyr.2026.109280
A copy of the paper is included in this repository: paper/LoBrano2026_EnergyReports.pdf
See also CITATION.cff for machine-readable citation metadata.
If you use this software in your research, please cite the article above.
Background
The single-diode model describes the I–V characteristic of a PV cell as:
I = I_L - I_0 [exp((V + I·R_s) / (n·N_s·V_th)) - 1] - (V + I·R_s) / R_sh
The five unknown parameters to be estimated are:
| Parameter | Symbol | Unit | Description |
|---|---|---|---|
| Photocurrent | I_L_ref |
A | Light-generated current at STC |
| Saturation current | I_o_ref |
A | Diode reverse saturation current at STC |
| Ideality factor | a_ref |
— | Modified diode ideality factor (n · N_s · V_th) |
| Series resistance | R_s |
Ω | Accounts for ohmic losses in contacts and bulk |
| Shunt resistance | R_sh |
Ω | Accounts for leakage current paths |
These parameters are estimated at STC (Standard Test Conditions):
- Irradiance: 1000 W/m²
- Cell temperature: 25 °C
Required Inputs
The algorithm needs only the values that appear on a standard PV module datasheet at STC:
| Input | Symbol | Unit | Description |
|---|---|---|---|
| Open-circuit voltage | Voc | V | Voltage when no current flows |
| Short-circuit current | Isc | A | Current when terminals are short-circuited |
| Maximum power | Pmax | W | Maximum power at the MPP |
| Voltage at MPP | Vmp | V | Voltage at the maximum power point |
| Current at MPP | Imp | A | Current at the maximum power point |
Optional inputs (advanced users):
| Input | Unit | Default | Description |
|---|---|---|---|
| α_sc (alpha_sc) | A/°C | 0.05 | Short-circuit current temperature coefficient |
| EgRef | eV | 1.121 | Band gap energy at reference (crystalline Si) |
| dEgdT | eV/K | −0.000267 | Temperature coefficient of band gap |
Output
The algorithm returns:
- The five SDM parameters (
I_L_ref,I_o_ref,a_ref,R_s,R_sh) at STC, which fully characterise the PV module. - Simulated key points (Voc, Isc, Vmp, Imp, Pmp from the fitted model) compared against the datasheet values.
- Total relative error — the weighted objective function value (lower is better), including individual errors on Voc, Isc, Vmp, Imp, and a stationarity residual at the maximum power point.
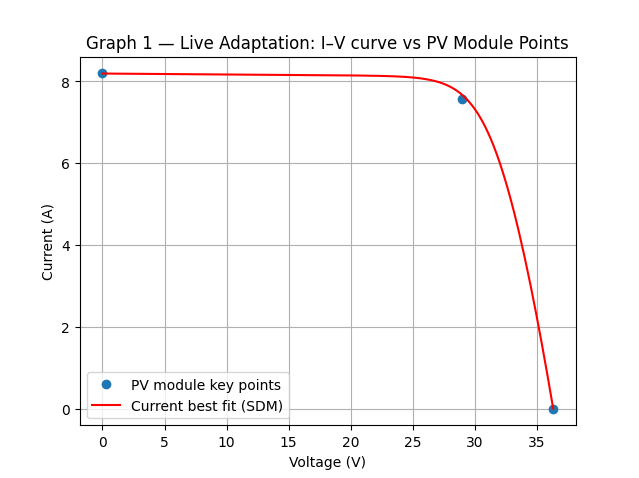
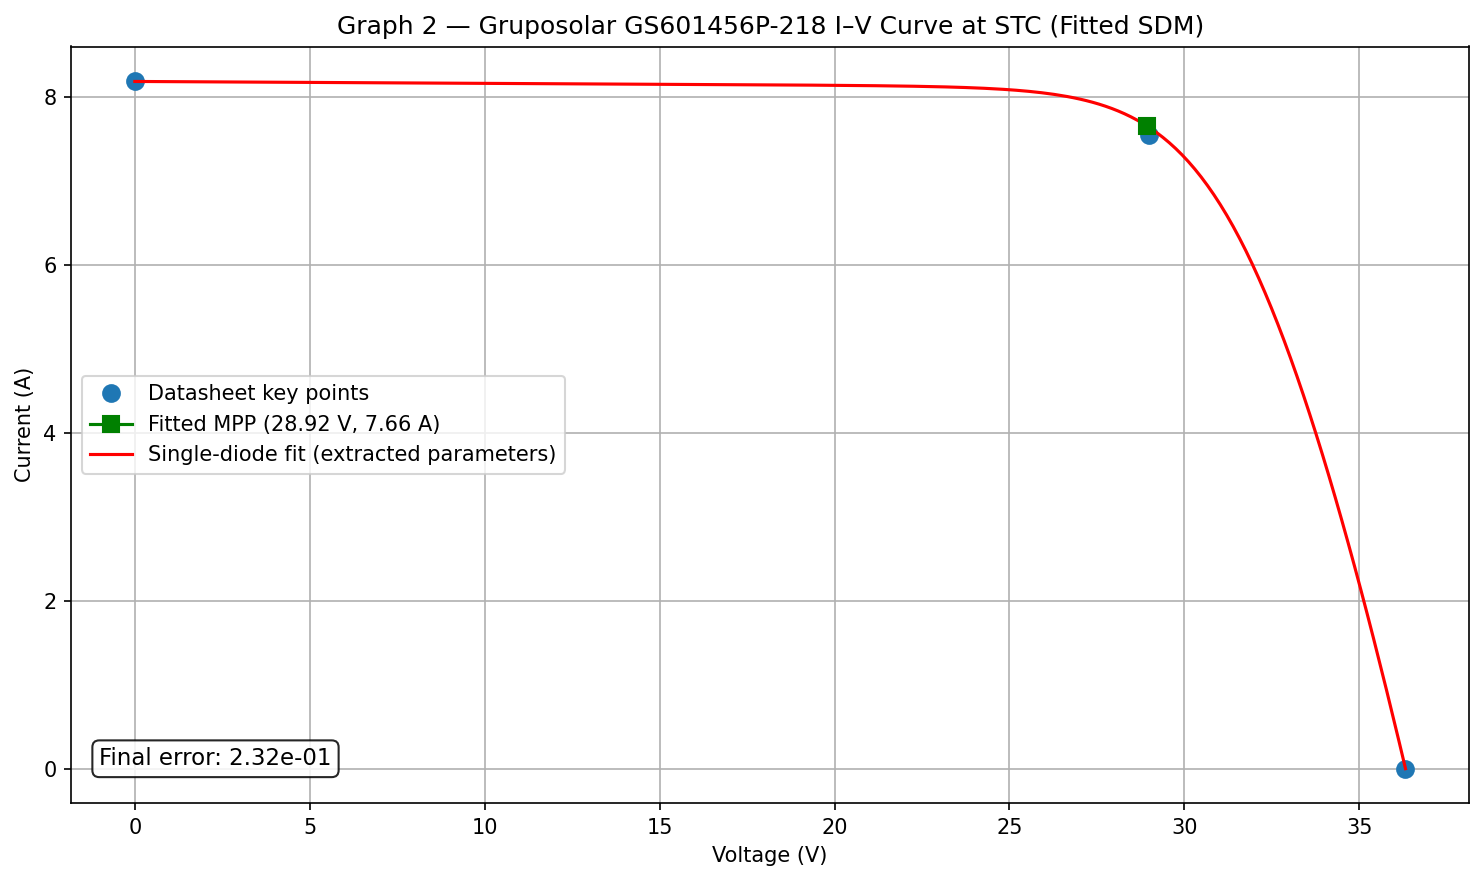
- I–V curve plot — a publication-quality figure showing the reconstructed curve with both the datasheet key points and the fitted maximum power point, so any discrepancy is immediately visible.
- Summary text file —
<MODULE_NAME>_CEC.txtwith all parameters and errors.
See example_output/Gruposolar_GS601456P-218.txt
for a complete text output example.
Example plots
Graph 1 — Live adaptation (updates during GA evolution, auto-closes):
Graph 2 — Final I–V curve (publication-quality, stays open):
Requirements
- Python ≥ 3.10
- pip
The following Python packages are required and are installed automatically by
pip install pvfit5:
| Package | Min version | Purpose |
|---|---|---|
| pvlib | 0.10 | CEC single-diode model and I–V solver (Lambert W) |
| DEAP | 1.4 | Genetic algorithm framework |
| NumPy | 1.24 | Numerical arrays |
| Matplotlib | 3.7 | Live and final I–V plots |
| SciPy | 1.10 | Statistical analysis |
| pandas | 2.0 | Dataframe handling and Excel I/O |
| openpyxl | 3.1 | Excel reading (.xlsx) |
| XlsxWriter | 3.1 | Excel writing (.xlsx) |
| seaborn | 0.12 | Statistical plots (batch analysis) |
| tqdm | 4.60 | Progress bar for the GA evolution |
Installation
Using pip
From PyPI:
pip install pvfit5
From GitHub (latest development version):
pip install git+https://github.com/valeriolobrano/pvfit5.git
For local development (editable install):
git clone https://github.com/valeriolobrano/pvfit5.git
cd pvfit5
pip install -e .
Using uv
uv is a fast Python package manager that can replace pip and virtualenv.
Add to an existing project:
uv add pvfit5
From GitHub:
uv add git+https://github.com/valeriolobrano/pvfit5.git
Run directly without installing (ephemeral):
uvx --from pvfit5 pvfit5 \
    --voc 36.3 --isc 8.19 --pmax 218.95 --vmp 29.0 --imp 7.55
Create a new project with pvfit5:
uv init my_pv_project
cd my_pv_project
uv add pvfit5
uv run pvfit5 --voc 36.3 --isc 8.19 --pmax 218.95 --vmp 29.0 --imp 7.55
Usage
Command line
After installing pvfit5, run it from the terminal with your module datasheet values:
pvfit5 --voc 36.3 --isc 8.19 --pmax 218.95 --vmp 29.0 --imp 7.55
All five datasheet values are required. Optional arguments:
| Argument | Description | Default |
|---|---|---|
--name |
Module name (for output files) | PVModule |
--error-target |
GA early-stop threshold | 1e-2 |
--alpha-sc |
α_sc in absolute units (A/°C) | 0.05 |
--alpha-sc-rel |
α_sc in relative units (1/°C); overrides --alpha-sc |
— |
--egref |
Band gap energy at reference conditions (eV) | 1.121 |
--degdt |
Temperature coefficient of band gap (eV/K) | -0.000267 |
--no-plot |
Disable live and final plots | — |
Full example:
pvfit5 --voc 36.3 --isc 8.19 --pmax 218.95 --vmp 29.0 --imp 7.55 \
       --alpha-sc 0.05 --egref 1.121 --name MyModule
Python library
from pvfit5.find_pv_parameters import fit_parameters, PVModuleData, STC, GAConfig

nd  = PVModuleData(voc=36.3, isc=8.19, pmax=218.95, vmp=29.0, imp=7.55)
stc = STC()                       # default: EgRef=1.121, dEgdT=-0.000267
ga  = GAConfig(error_target=1e-2)

results, summary = fit_parameters(nd, stc, ga, module_name="MyModule")
print(summary)

# Access individual results
print("R_s  =", results["best_individual"]["R_s"], "Ω")
print("R_sh =", results["best_individual"]["R_sh"], "Ω")
Plots
The script opens two plots:
- Graph 1 (live): I–V curve updating during GA evolution (auto-closes after 3 s).
- Graph 2 (final): publication-quality I–V curve with annotated errors
(stays open). Use
--no-plotto suppress both.
Batch Validation (optional)
Run the algorithm on a large set of modules from the pvlib CEC database:
# Analyse 100 modules in alphabetical order
pvfit5-batch -n 100 --selection alpha

# Analyse 200 random modules (reproducible with --seed)
pvfit5-batch -n 200 --selection random --seed 42 --output my_results.xlsx
Results are saved to an Excel file. Run pvfit5-batch --help for all options.
Analysing Batch Results (optional)
After running pvfit5-batch, analyse the output Excel file:
# Analyse the default output file
pvfit5-analysis

# Analyse a specific file
pvfit5-analysis my_results.xlsx

# Suppress figure output
pvfit5-analysis my_results.xlsx --no-figures
The script produces:
- PDF and CDF plots for RMSE and runtime.
- Dominance analysis of partial errors.
results_summary.xlsxwith descriptive statistics.
For per-technology statistics:
pvfit5-parametric

# Or with a specific input and output file
pvfit5-parametric my_results.xlsx --output my_statistics.xlsx
License
Released under the BSD-3-Clause License. Free to use, modify, and redistribute, provided the original copyright notice is retained. The software is provided without warranty of any kind.


Download files
Download the file for your platform. If you're not sure which to choose, learn more about installing packages.
Source Distribution
Built Distribution
Filter files by name, interpreter, ABI, and platform.
If you're not sure about the file name format, learn more about wheel file names.
Copy a direct link to the current filters
File details
Details for the file pvfit5-1.2.0.tar.gz.
File metadata
- Download URL: pvfit5-1.2.0.tar.gz
- Upload date:
- Size: 2.2 MB
- Tags: Source
- Uploaded using Trusted Publishing? No
- Uploaded via: twine/6.2.0 CPython/3.12.7
File hashes
| Algorithm | Hash digest | |
|---|---|---|
| SHA256 |
3f794baf6c86f5f25e6407becf5824a5ab72526451982926a7f8b4a78de9c2ed
|
|
| MD5 |
c2aaf7b73353a59032e562c098a71998
|
|
| BLAKE2b-256 |
422904bd05173ab82d7737e7f8392220d47ed946ea1a079761a083c43ebeabf8
|
File details
Details for the file pvfit5-1.2.0-py3-none-any.whl.
File metadata
- Download URL: pvfit5-1.2.0-py3-none-any.whl
- Upload date:
- Size: 32.8 kB
- Tags: Python 3
- Uploaded using Trusted Publishing? No
- Uploaded via: twine/6.2.0 CPython/3.12.7
File hashes
| Algorithm | Hash digest | |
|---|---|---|
| SHA256 |
d104f73aa56cbc711d231325c3fcf7ecbffeeae6e0d96a00b4b0db164bdb0900
|
|
| MD5 |
e4be9c0eaf49cdb876b8dec00005267c
|
|
| BLAKE2b-256 |
29d434eb12625a4942ce016c0d2d42e45240ae388d865d1c2d057464ed3e755b
|


